OpenTelemetry Incremental Adoption Strategies
OpenTelemetry is rapidly becoming the de facto standard for telemetry collection. My highly scientific show-of-hands polls during a couple of public speaking engagements over the last year show steadily rising awareness and adoption.
OpenTelemetry (OTel) is a framework designed to collect logs, metrics, traces, and other signals. It includes a set of SDKs, semantic conventions, a protocol specification, and an agent called the OpenTelemetry Collector, essentially a modular data pipeline processor. OTel goal is to eliminate vendor lock-in and unify how telemetry is collected and transported.
On the other hand, OpenTelemetry isn't a backend, database, or visualization system. Users bring their own Elastic, Grafana, ClickHouse, Datadog, or whatever else fits their stack. The promise is to be able to swap the observability database/console without re-instrumenting everything.
OpenTelemetry's main strengths are its vendor-neutral approach, drive toward unified instrumentation, and promise of easy backend switching. However, these benefits come with some limitations: significant complexity, committee-driven evolution, and uneven maturity across components. Integration into existing stacks presents another challenge: while third-party distributions can help, they often introduce bloat and vendor bias, undermining OTel's core philosophy of neutrality.
In this post, I will cover three main themes. Feel free to skip to the section that is more relevant to you.
- First, a brief introduction to the OpenTelemetry collector for those who need it.
- Second, how to plan and implement the collection infrastructure to gather telemetry data and send it to an observability backend.
- Third, some adoption strategies that have worked for me when implementing OpenTelemetry.
For the TL;DR, jump to fostering adoption.
Part one: The OpenTelemetry collector
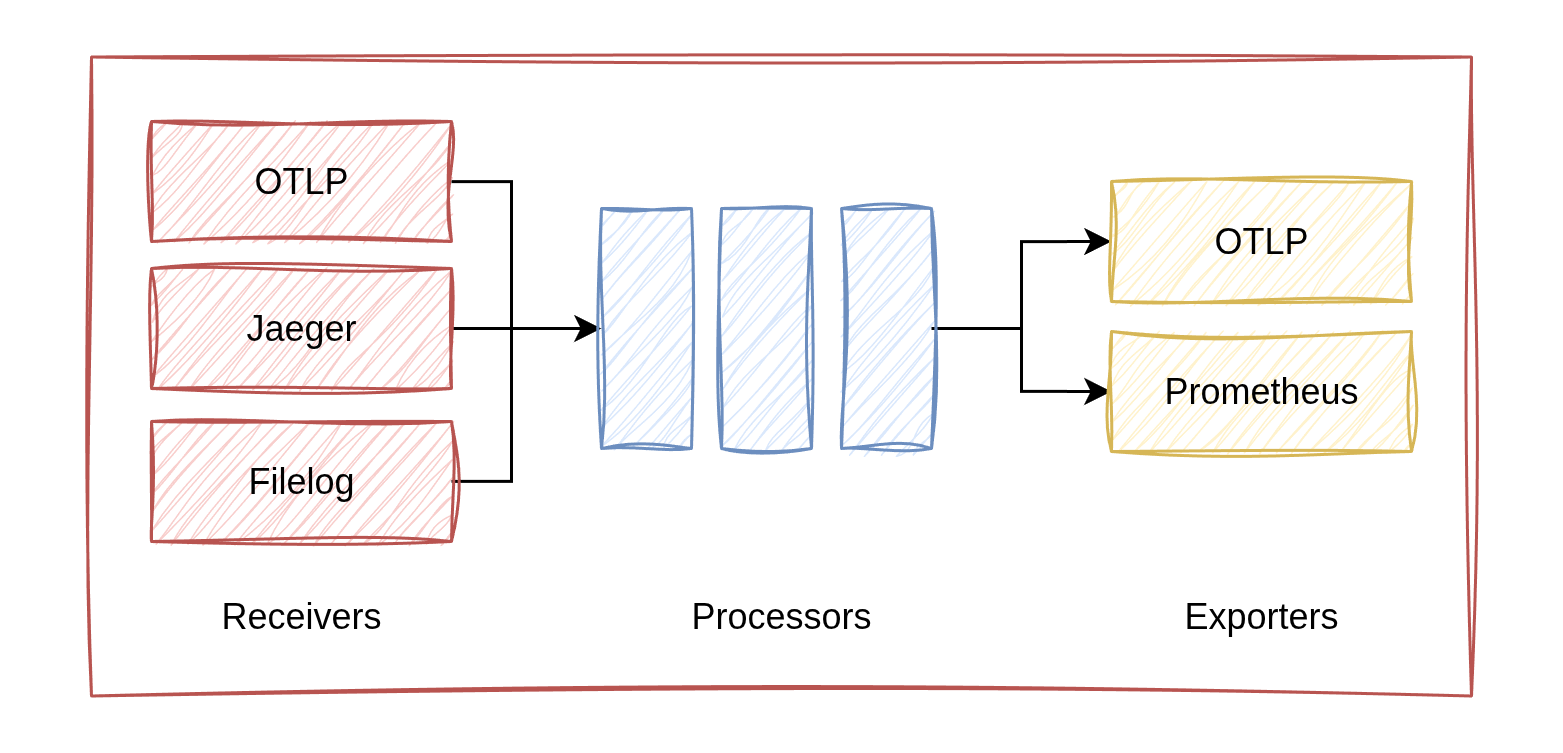
The OpenTelemetry Collector is the agent of the OTel collection infrastructure. It consists of three main building blocks:
- Receivers - Ingest data through 90+ supported mechanisms and protocols. Some receivers open a service to accept connections (such as OTLP protocol endpoints), while others actively fetch data (such as reading log files or consuming from syslogs).
- Processors - Modify, enrich, filter, or compress data as it flows through the pipelines. A common use case is enriching messages with metadata, such as adding Kubernetes container information (service names, pod labels, etc.).
- Exporters - Send data to backends or forward it to another collector. Many backends natively support the OTLP protocol for direct integration.
So it's possible to build multiple pipelines by connecting the building blocks. You can search for available collector components on the OpenTelemetry Registry
The collector is distributed as a binary or container image. Given the large number of available components, you can build a custom distribution using the OpenTelemetry Collector Builder. However, several pre-built distributions are available: a core distribution with basic essential components, a contrib distribution with a much wider selection of components (not recommended for production use), and a Kubernetes distribution specifically tailored for Kubernetes environments.
Additionally, many observability vendors offer third-party distributions that bundle a customized OpenTelemetry Collector with vendor-specific tools and configurations optimized for their platform or cloud ecosystem. I generally avoid third-party distributions for several reasons. They can be bloated and overly complex, they don't align well with an incremental adoption approach (typically the most practical path forward), and they undermine OpenTelemetry's core benefit of avoiding vendor lock-in. That said, vendor distributions can serve as inspiration to understand how to observe a certain ecosystem.
The collector is configured using, you guessed it, a YAML file. Here's a basic example:
receivers:
 otlp:
   protocols:
     grpc:
       endpoint: localhost:4317
     http:
       endpoint: localhost:4318

processors:
 batch:

exporters:
 otlp:
   endpoint: backend:4317

service:
 pipelines:
   logs:
     receivers: [otlp]
     processors: [batch]
     exporters: [otlp]
Part two: The collection infrastructure
Collecting data from virtual machines
The typical approach is to put the OTel collector in the VM, with one process per VM. This is not mandatory; for example, an application that is natively instrumented with OTel SDK could send directly to a centralized collector. This may work in simple cases, but a local process offers more capabilities, for example scraping logs files, fetching syslog and getting local metrics. So, having a local collector is recommended for most setups.

The typical datacenter-level architecture uses a centralized collector acting as a gateway that forwards data to the backend(s). Each collector instance can be configured with the appropriate level of resilience. For example, it can buffer telemetry in local storage to handle situations when the backend is unavailable or unable to receive data.

In some scenarios, a third hierarchical level makes sense, such as when instrumenting multiple datacenters; such an approach can simplify authentication logic and improve compression efficiency, as well as providing a local storage to increase resiliency to wide-area network failures.
Resiliency
Resiliency mechanisms can be configured. By default, the sending queue is kept in memory, which can result in data loss during failures. To increase resiliency, you can also configure file-based storage to keep messages on disk, preventing data loss during network outages or backend issues. Another useful mechanism is batching, which groups messages together to improve compression and throughput. In the present of a highly available Kafka deployment, you can use it to decouple senders and receivers for additional resilience.
# Sending queue (in memory) + retry on failure
exporters:
  otlp:
    sending_queue:
      queue_size: 5000
    retry_on_failure:
      initial_interval: 5s
      max_interval: 30s
      max_elapsed_time: 10m
# Sending queue (persisted on disk) + batching
...
...
sending_queue:
storage: file_storage
batch:
enabled: trueInfrastructure-as-Code and monitoring
As you need to release and manage a fleet of observability agents, you should use infrastructure as code. Assuming you already have an established IaC tool in place (if not, you have bigger problems to solve first!), use it to install, update, and configure your OpenTelemetry collectors. I've successfully used Ansible to configure collectors on virtual machines. For Kubernetes environments, leverage whatever tooling you already have, whether that's Terraform, Helm, ArgoCD, or other solutions.
Remember to automate dashboards and alerting configurations as well, not just the collectors themselves.
You also need to monitor the collection infrastructure itself. The OpenTelemetry collector exports its own telemetry (logs and metrics), allowing to set up alerts for indicators like queue sizes, CPU and memory usage, and HTTP request duration. These metrics can help detect issues such as backpressure or stuck pipelines. The primitives are available, but you'll need to configure the monitoring yourself.
There is also an emerging standard called OpAMP (Open Agent Management Protocol), which aims to provide centralized management for observability agent fleets, including monitoring, configuration, and automatic upgrades. OpAMP is implemented in the collector but not enabled by default. While there's an SDK available for building a server, you'll need to develop the server-side components yourself. I would approach OpAMP adoption cautiously at this stage.
Part three: Adoption patterns
Let's talk about adoption patterns that have helped successful OpenTelemetry implementations in my experience. OTel has two primary approaches for collecting telemetry.
The first is collecting existing telemetry, which involves gathering telemetry already produced by existing systems or libraries through collector integrations. This approach requires no code changes and is particularly helpful for integrating third-party environments or legacy systems.
The second is native instrumentation, which means adding the OpenTelemetry SDK directly into application code to generate custom traces, metrics, and logs that flow directly to the collector. This approach also offers zero-code auto-instrumentation options that require no manual code changes. While more complex initially, native instrumentation provides better return on investment in the medium term.
A Possible Approach
- Step 1: Build the collection infrastructure and collect existing telemetry. This approach provides quick coverage across many services and works well for legacy applications or third-party software where code changes aren't feasible. The main limitations are that structured logs typically require parsing, and achieving proper correlation between telemetry signals can be challenging.
- Step 2: Add native instrumentation using zero-code auto-instrumentation. This step leverages the automatic instrumentation capabilities built into language runtimes and popular libraries, providing better telemetry without requiring code modifications.
- Step 3: Implement code-based native instrumentation. This requires modifying application code but enables first-class correlation using
span_idandtrace_id, makes it easier to adopt semantics conventions, and delivers the best long-term return of investment.
This phased approach is designed for organizations with existing applications and infrastructure. When starting from scratch, you can be more aggressive and jump directly to native instrumentation from the beginning.
Collect existing telemetry in virtual machines
The OpenTelemetry collector can be deployed using infrastructure as code on VMs, typically as a systemd service, or in a container where appropriate. Once deployed, you can collect local log files using the filelog receiver to parse plain text logs. In this configuration, it is possible to extract fields like timestamp and severity, encoding them according to the OpenTelemetry protocol semantic. Custom field mappings are also available.
For example, for the following text log:
2023-06-19 05:20:50 ERROR This is a test error message
2023-06-20 12:50:00 DEBUG This is a test debug message
it is possible to use the following collector configuration:
# config.yaml
receivers:
  filelog:
    include: [ /var/log/myservice/*.log ]
    operators:
      - type: regex_parser
        regex: '^(?P<time>\d{4}-\d{2}-\d{2} \d{2}:\d{2}:\d{2}) (?P<sev>[A-Z]*) (?P<msg>.*)$'
        timestamp:
          parse_from: attributes.time
          layout: '%Y-%m-%d %H:%M:%S'
        severity:
          parse_from: attributes.sev
A similar approach works for JSON log files:
{"time":"2025-09-28 20:15:12","level":"INFO","message":"User logged in successfully","user_id":"u-123","source_ip":"192.168.1.100"}
{"time":"2025-09-28 20:15:45","level":"WARN","message":"Password nearing expiration","user_id":"u-123"}
# config.yaml
receivers:
filelog:
include: [ /var/log/myservice/*.log ]
operators:
- type: json_parser
timestamp:
parse_from: attributes.time
layout: '%Y-%m-%d %H:%M:%S'
severity:
parse_from: attributes.levelOn Windows, the windowseventslog receiver collects system logs. On all operating systems, the hostmetrics receiver gathers VM-level metrics. The following example also demonstrates using a processor to enrich telemetry with additional metadata. Other versions of that processor exist to get metadata for virtual machines in cloud providers.
# config.yaml
receivers:
  windowseventlog/application:
     channel: application
  windowseventlog/system:
     channel: system

  hostmetrics/all:
    collection_interval: 30s
    scrapers:
      cpu:
      memory:
      network:
      filesystem:


processors:
  resourcedetection/system:
    detectors: ["system"]
    system:
      hostname_sources: ["os", "dns", "cname", "lookup"]
Collect existing telemetry from Kubernetes

OpenTelemetry provides tooling for Kubernetes, available as a Helm chart or operator (though I haven't tested the operator yet). The documentation could be more comprehensive, but the package is generally well done, consisting of two main components.
- The first is a per-node collector deployed as a DaemonSet, which collects container logs and metrics about CPU and memory usage at the container level.
- The second is a per-cluster collector that uses Kubernetes APIs to gather cluster-wide data such as events, resource requests, and other cluster metrics.
A processor is included to enrich messages with metadata to provide context and filtering capabilities.
Native instrumentation: Zero-code
OpenTelemetry zero-code instrumentation (also called auto-instrumentation) automatically captures telemetry data from applications without requiring manual code modifications. The implementation mechanism varies by language and depends on whether the components and libraries you're using are already supported, so coverage can vary significantly. Currently, auto-instrumentation is available for a subset of languages: .NET, Go, Java, JavaScript, PHP, and Python.
For example, adding auto-instrumentation to a basic Node.js Express application looks like this:
npm install --save @opentelemetry/api
npm install --save @opentelemetry/auto-instrumentations-node

env \
  OTEL_TRACES_EXPORTER=otlp \
  OTEL_SERVICE_NAME=my-service \
  node --require @opentelemetry/auto-instrumentations-node/register app.js
const express = require('express');
const app = express();
app.get('/test', (req, res) => {
res.send(test());
});
app.listen(PORT, () => {
console.log(`Listening for requests on http://localhost:${PORT}`);
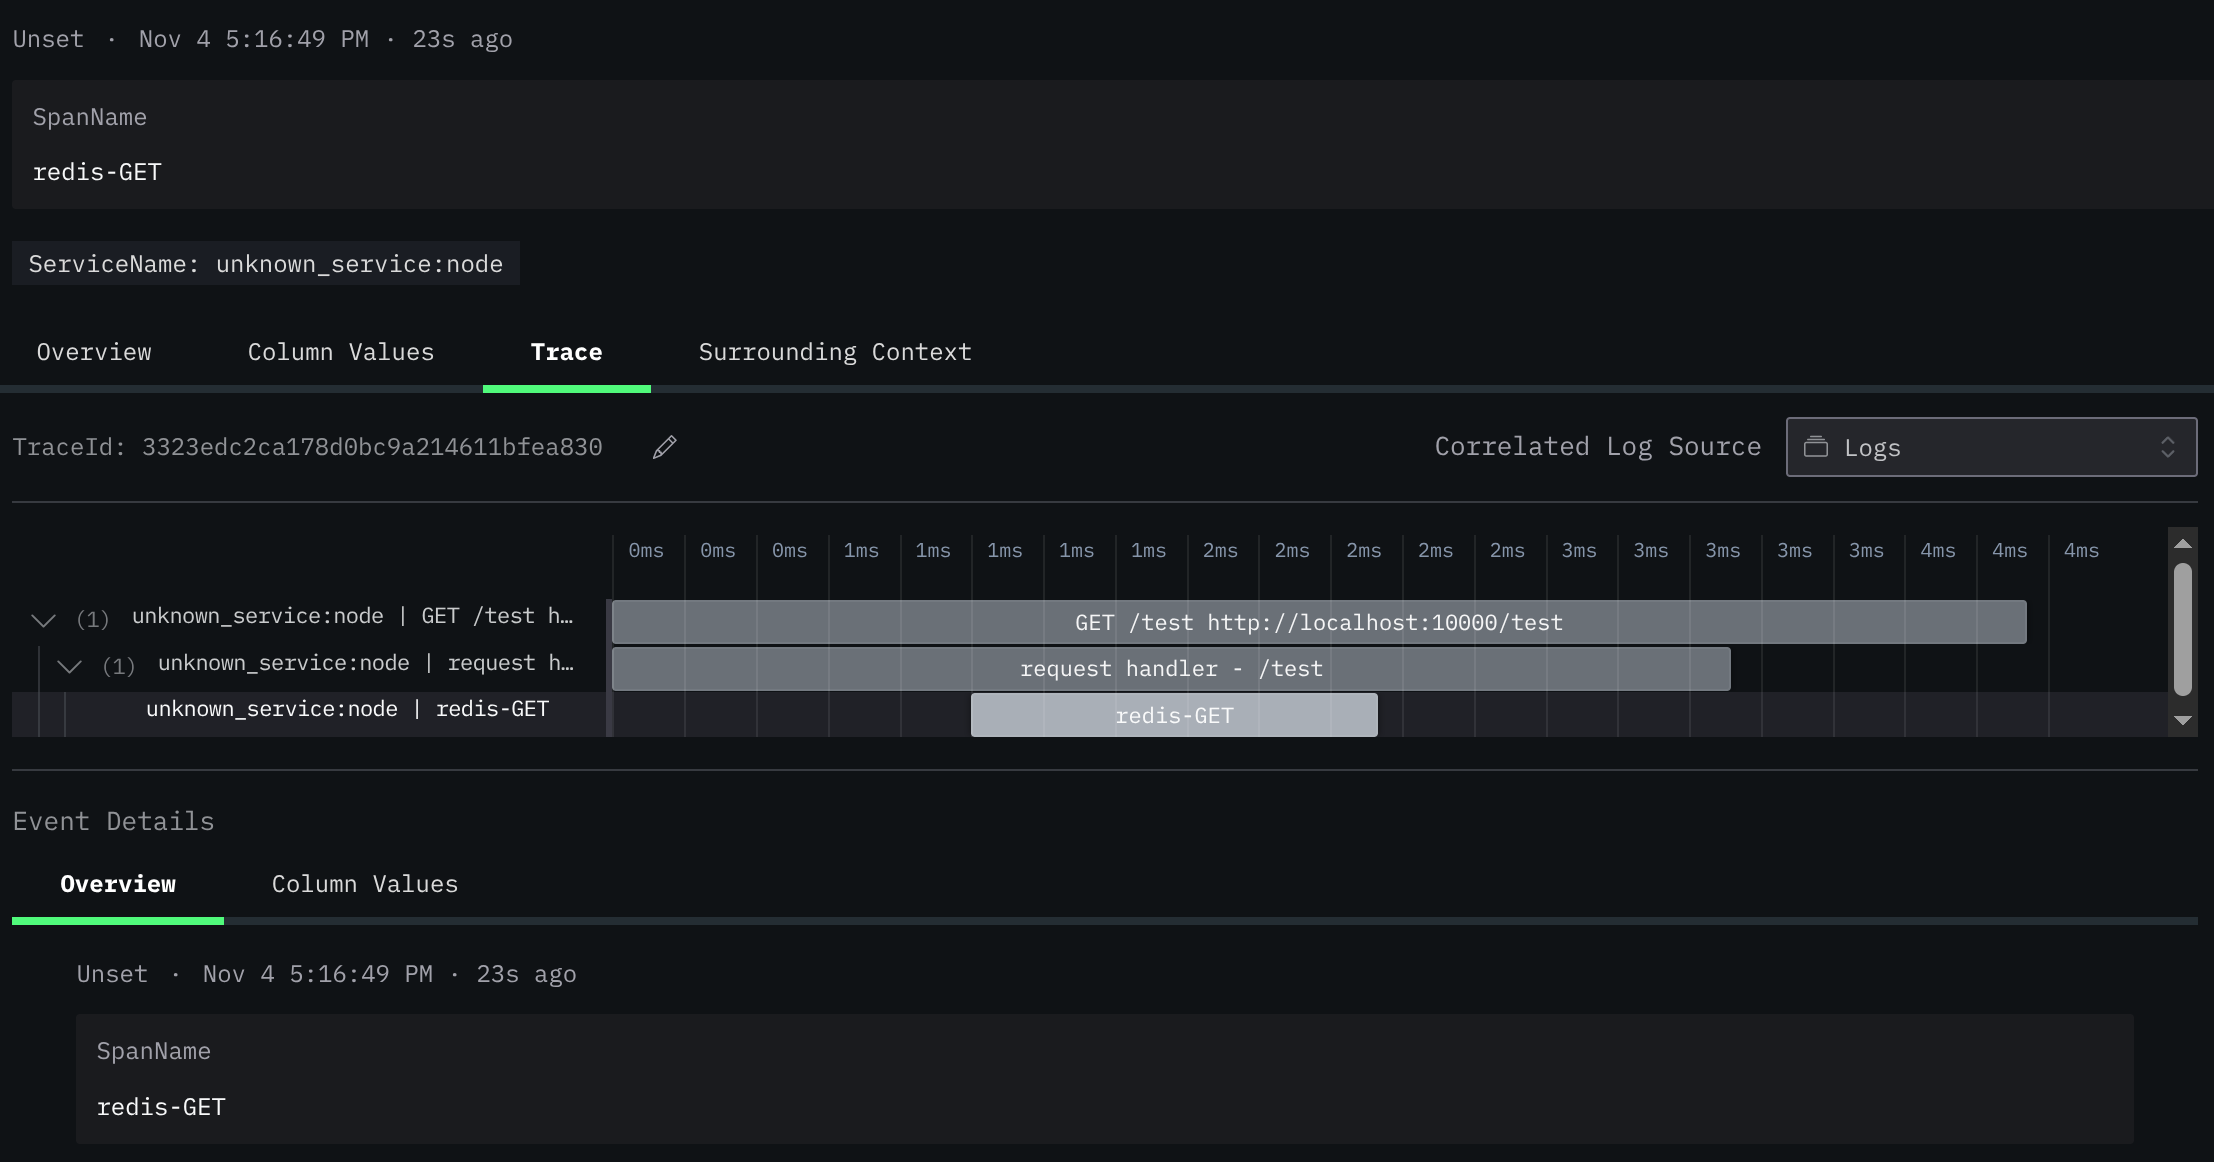
});This produces a trace containing spans generated by both the Express web framework and the Node.js HTTP module. The trace also demonstrates context propagation, with the trace ID being carried across the entire request flow. The following is an excerpt of the generated trace:
info Traces {"resource": {... "service.name": "my-service", "resource spans": 1, "spans": 2}
...
Resource attributes:
-> host.name: Str(d01.fornasa.it)
-> host.arch: Str(amd64)
-> host.id: Str(002878404e9747208b6ca9cebc484f92)
-> process.pid: Int(518406)
...
-> service.name: Str(my_app)
-> telemetry.sdk.language: Str(nodejs)
-> telemetry.sdk.name: Str(opentelemetry)
-> telemetry.sdk.version: Str(2.1.0)

ScopeSpans #0
ScopeSpans SchemaURL:
InstrumentationScope @opentelemetry/instrumentation-express 0.54.0

Span #0
Trace ID       : fa24cb81e96176b5614efce4ccf22e89
Parent ID      : 7350ff8549ac0451
ID             : 50a309fa91fa761b
Name           : request handler - /test
Kind           : Internal
Start time     : 2025-10-21 13:53:48.282 +0000 UTC
End time       : 2025-10-21 13:53:48.284842068 +0000 UTC
Status code    : Unset
Status message :
Attributes:
-> http.route: Str(/test)
-> express.name: Str(/test)
-> express.type: Str(request_handler)

ScopeSpans #1
ScopeSpans SchemaURL:
InstrumentationScope @opentelemetry/instrumentation-http 0.205.0

Span #0
Trace ID       : fa24cb81e96176b5614efce4ccf22e89
Parent ID      :
ID             : 7350ff8549ac0451
Name           : GET /test
Kind           : Server
Start time     : 2025-10-21 13:53:48.28 +0000 UTC
End time       : 2025-10-21 13:53:48.285022049 +0000 UTC
Attributes:
-> http.url: Str(http://localhost:8000/test)
-> http.host: Str(localhost:8000)
-> http.method: Str(GET)
...
-> http.status_code: Int(200)
-> http.status_text: Str(OK)
-> http.route: Str(/test)
The trace can then be sent to a visualization backend (in this case, Clickstack).

The Node.Js Redis client is also instrumented:
...

const redis = require('redis');

...

const redisClient = redis.createClient();
redisClient.connect();

...

async function test() {
  const value = await redisClient.get('some_key');
  return content();
}

app.get('/test', async (req, res) => {
  res.send(await test());
});
So a Redis call will generate a span, and context propagation will work out of the box
Organizations may benefit from developing boilerplate code to configure automatic instrumentation. Given that this configuration is typically consistent across teams, packaging it as a maintained internal library is often the most effective distribution method.
In the following example, an additional HTTP header is added to the SDK output.
import { NodeSDK } from '@opentelemetry/sdk-node';
import { getNodeAutoInstrumentations } from '@opentelemetry/auto-instrumentations-node';
import { ConsoleSpanExporter } from '@opentelemetry/sdk-trace-node';
import { OTLPTraceExporter } from '@opentelemetry/exporter-trace-otlp-proto';
import { OTLPMetricExporter } from '@opentelemetry/exporter-metrics-otlp-proto';
import { PeriodicExportingMetricReader } from '@opentelemetry/sdk-metrics';


const sdk = new NodeSDK({
  traceExporter: new OTLPTraceExporter({
    url: 'http://localhost:4318/v1/traces',
    headers: {
      authorization: 'secret'
    }
  }),
  instrumentations: [getNodeAutoInstrumentations()],
});

sdk.start();
Native instrumentation: Code-based
Once both the collection infrastructure and automatic instrumentation are set up, it's straightforward to enhance telemetry by adding explicit calls. Building on the previous example, I can add spans for three actions (A, B, C). In JavaScript this works out as follows:
await tracer.startActiveSpan('taskA', async (span) => {
  await taskA();
  span.end();
});

await tracer.startActiveSpan('taskB', async (span) => {
  await taskB();
  span.end();
});

await tracer.startActiveSpan('taskC', async (span) => {
  await taskC();
  span.end();
});
This results in the following trace, where we can see that the context propagation is maintained for the additional spans:

Fostering adoption
In conclusion, here are some key aspects that are in my opinion crucial in order to foster adoption.
First, make sure that developers have easy access to observability consoles, especially for production! This seems rather obvious, but this access is surprisingly often blocked or complicated by technical and organizational hurdles.
Second, start with automatic instrumentation, as it can help get things moving.
Third, create internal wrappers to abstract OpenTelemetry complexities and ease adoption. Ideally, these should be one-line imports for the most commonly used languages and frameworks.
Fourth, develop adapters (compatibility layers) for existing instrumentation to convert from current telemetry sources. These adapters must have clear ownership and be actively maintained.
Finally, consider a transition period with parallel operations, where teams write to both the old and new observability systems.